
Trading Chart Patterns
Trading Chart Patterns
Trading is not just about buying and selling randomly. It is a skill, a discipline, and most importantly, a way of understanding market behavior. Whether you are trading Forex, stocks, crypto, or commodities, one thing remains true:
--> Charts are the language of the market.
And within charts, the most powerful tool traders use is chart patterns.
Trading Chart patterns help you see what price is doing, what traders are feeling, and where the market may move next. But many beginners make the mistake of thinking they need complex indicators or advanced software.
The reality is simple:
✅ The best traders often rely on simple trading charts and clean chart patterns to make decisions.
In this blog, we will explore:
- Why simple trading charts are important
- How to make charts more helpful
- Common chart patterns with examples
- How to learn trading step by step
- How we teach chart pattern trading
- Why our approach is the best
a) Why Simple Trading Charts Patterns?
A simple trading chart is a clean chart that focuses mainly on price movement, key levels, and pattern behavior.
When you are studying trading chart patterns, simplicity becomes even more important.
1. Patterns Are Easier to Spot
Chart patterns like:
- Head and Shoulders
- Triangles
- Flags
- Double Tops
are visual formations.
If your chart is cluttered with too many indicators, these patterns become harder to recognize.
A clean chart helps your eyes quickly identify market structure.
2. Simple Charts Reduce Confusion
Many beginners add multiple indicators such as RSI, MACD, Bollinger Bands, and Stochastic Oscillators.
Soon, they face mixed signals:
- One indicator says “Buy”
- Another says “Sell”
- Another says “Wait”
This creates stress and hesitation.
Simple charts keep your focus on what truly matters:
* Price action and patterns.
3. Price Action Comes First
Chart patterns are built from raw price movement.
Indicators are often lagging, meaning they tell you what already happened.
But chart patterns show you what is developing in real time.
That’s why professional traders always start with price first.
4. Works in Every Market
Trading Chart patterns are universal.
They work in:
- Forex
- Stocks
- Crypto
- Commodities
Because human emotions like fear and greed exist in every market.
Simple charts help you trade anywhere confidently.
b) How to Help Simple Trading Charts Patterns?
To make a simple trading chart more effective for pattern trading, you need a clean setup.
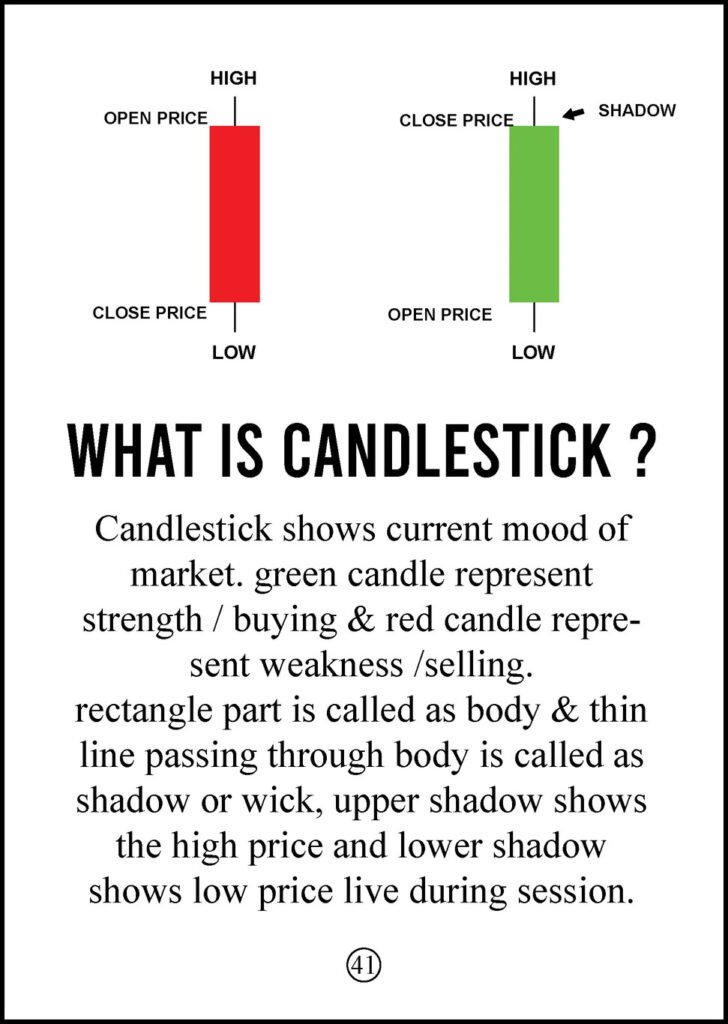
1. Use Candlestick Charts
Candlestick charts are best because they show:
- Open
- Close
- High
- Low
Candles also show market psychology clearly.
A strong bullish candle shows buying pressure.
A long wick shows rejection.
This helps confirm chart patterns.
2. Focus on Support and Resistance
Patterns work best around key levels.
Support = price floor
Resistance = price ceiling
For example:
- A breakout pattern near resistance is powerful
- A reversal pattern near support is meaningful
Drawing levels makes patterns more reliable.
3. Add Only One Trend Tool
If needed, use one moving average:
- 50 MA for medium trend
- 200 MA for long-term trend
This helps you trade patterns in the direction of the trend.
4. Remove Unnecessary Noise
A helpful chart should include:
✅ Price
✅ Levels
✅ Pattern
✅ One indicator (optional)
Avoid:
❌ Too many signals
❌ Bright distractions
❌ Over-analysis
Clean charts = clear decisions.
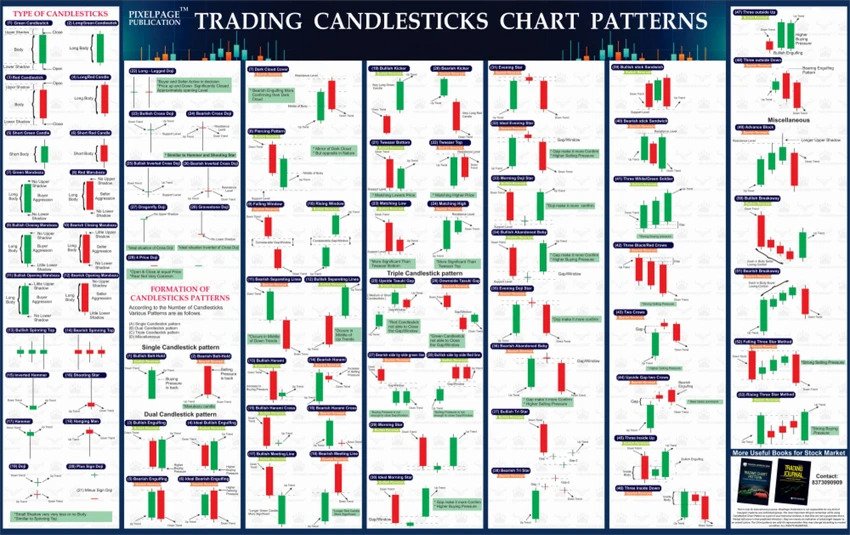
c) Trading Chart Patterns Examples and Details
Chart patterns are repeatable shapes formed by price movement.
Here are the most important ones:
1. Head and Shoulders Pattern
This is a reversal pattern.
Structure:
- Left shoulder
- Head (higher peak)
- Right shoulder
- Neckline break
Meaning:
==> Trend may reverse from bullish to bearish.
Trading idea:
Sell after neckline breakdown.
2. Double Top Pattern
This happens when price fails to break resistance twice.
Looks like:
- Peak → pullback → second peak → breakdown
Meaning:
Buyers are weak, sellers may take control.
3. Double Bottom Pattern
Opposite of double top.
Price bounces twice from support.
Meaning:
—> Market may reverse upward.
4. Triangle Patterns
Triangles show consolidation before breakout.
Types:
- Ascending triangle (bullish)
- Descending triangle (bearish)
- Symmetrical triangle (neutral)
Trading idea:
Trade breakout direction with volume confirmation.
5. Flag and Pennant Patterns
These are continuation patterns.
After a strong move, price pauses in a small range, then continues.
Meaning:
Trend is likely to continue.
Simple Trading Chart Patterns Picture
d) How We Learn Trading Chart Patterns
Learning trading is like learning a new language.
Chart patterns become easier with structured practice.
1. Learn the Basics First
Start with:
- Candlesticks
- Trend direction
- Support and resistance
Without basics, patterns won’t make sense.
2. Study One Pattern at a Time
Don’t try to learn 20 patterns in one week.
Master a few key ones:
- Double top/bottom
- Triangles
- Head and shoulders
- Flags
Depth is better than quantity.
3. Practice on Demo Accounts
Demo trading allows you to apply patterns without risk.
You learn:
- Entries
- Stop-loss placement
- Breakout confirmation
Confidence grows through practice.
4. Replay Historical Charts
One of the best methods:
- Look at past charts
- Identify patterns
- See how price reacted
This trains your brain for real-time recognition.
5. Risk Management is Essential
Even the best pattern fails sometimes.
That’s why traders always use:
- Stop-loss
- Proper position sizing
- Risk-to-reward rules
Professional traders survive because they manage risk.
e) How We Teach Trading Chart Patterns
Our teaching approach is designed for simplicity and real results.
1. Step-by-Step Pattern Training
We teach patterns from beginner to advanced:
- Structure
- Psychology
- Confirmation
- Entry/exit strategy
No guessing, only clear rules.
2. Live Chart Practice
We provide real market sessions where students learn:
- Spotting patterns live
- Understanding breakout behavior
- Managing trades in real time
This is where real skill develops.
3. Pattern + Price Action Strategy
We don’t teach patterns alone.
We combine them with:
- Support/resistance
- Trend direction
- Volume confirmation
This creates high-probability setups.
4. One-on-One Support
Every learner is different.
We guide students personally so they improve faster.
5. Trading Psychology Coaching
Patterns work best when traders stay disciplined.
We teach:
- Patience
- Emotional control
- Consistency
- Confidence
Mindset is the hidden edge.
f) Why We Are the Best Choice in Trading Chart Patterns
Many people teach trading, but our focus is different:
👉 Simple charts, clear patterns, real growth.
1. We Teach What Works
No overcomplicated systems.
Just proven chart pattern strategies.
2. Beginner-Friendly Learning
We explain trading in a way anyone can understand.
3. Real Market Experience
Our lessons are based on real chart behavior, not theory.
4. Long-Term Skill Building
We build traders, not gamblers.
Our goal is consistency, not quick hype.
5. Strong Student Support
We provide guidance, community, and continuous learning.